Budget
Octo's budget management feature allows users to control and monitor spending for their cost groups. It provides tools to create budgets for various periods, set up automated notifications, and track real-time expenditure against the allocated budget.
Creating a Budget
To create a budget in Octo, follow these steps:
Navigate to the Budget Management Tab:
- Go to the "Cost Group" section in the left pannel.
- Select the specific cost group for which you want to create a budget and then head over to the budget tab.
Initiate Budget Creation:
- Click the "Create Budget" button. A three-step pop-up dialog will appear to start the creation process.

Step 1: Select Budget Period:
- Choose the budget period: "Three Months," "Six Months," or "Twelve Months."
- Specify the "Customize Starting and Ending Month" by selecting a start date then click Next. Note that the end date will automatically be calculated based on the chosen period (e.g., three months minus one day) .


Step 2: Set Name and Budget Amount:
Give your budget a clear, descriptive name (e.g., Q1 2026 – Prod, 12-Month R&D Budget).

Supply the amount of budget you want to set and take a look on the chart above as it simply provides a visual representation of this data.
- Forecast Data: This is derived from historical usage patterns; more past data leads to more accurate forecasting. This helps to manage the amount of budget you want to allocate for that cost group. Refer to this docs for more information.
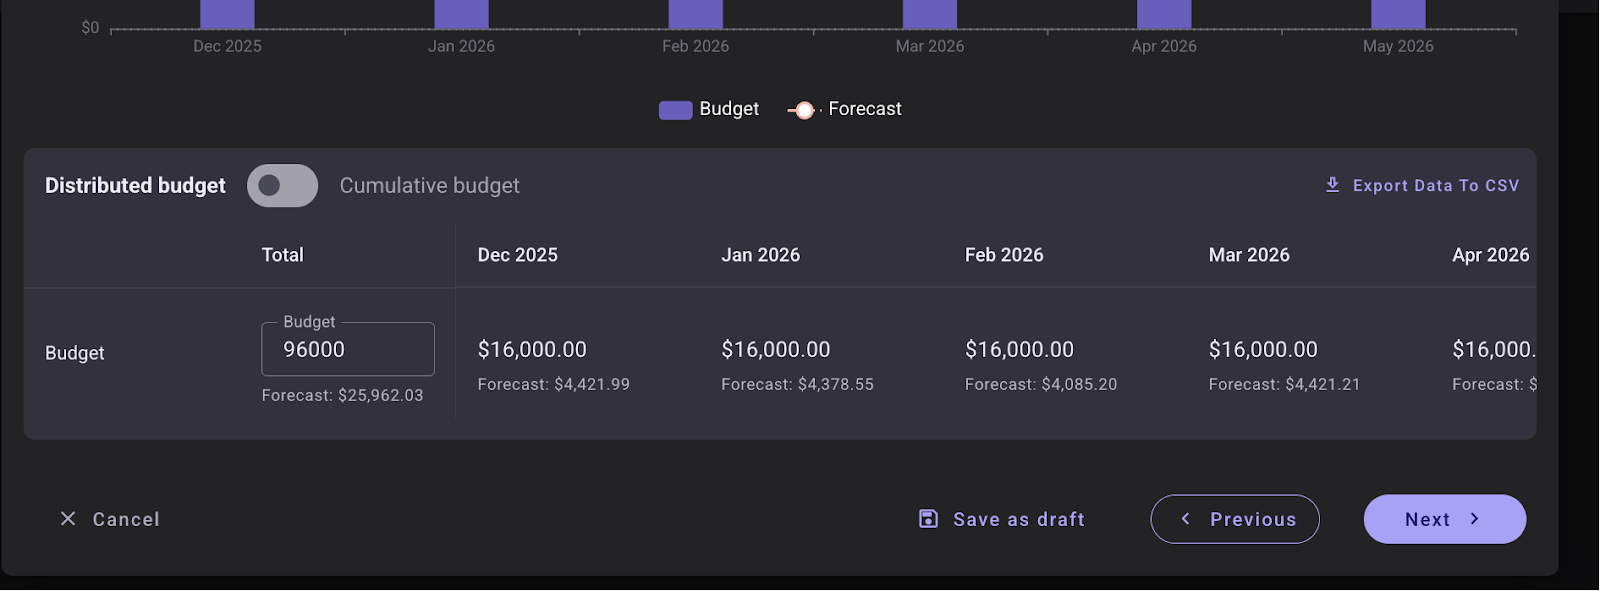
- Budget: This is where you configure your budget.
- Choose Budget Type:
- Distributed Budget: Enter a "Total Budget" amount, and it will be equally divided across all months in the selected period.
- Cumulative Budget: Toggle this option to manually input a different budget amount for each month. Warning: Switching from a cumulative to a distributed budget will reset all manually entered monthly values to zero.

-
Optionally, click "Export Data to CSV" to export and download the data you have entered.
-
Save as Draft: If you are not yet ready to activate the budget, click "Save as Draft." You can configure or delete drafts later from the main budget view list.

- Create Budget: When you're satisfied with the allocated budget amount, click Next, then click the Create Budget button to complete the process.

Note: Set Budget Notification (Optional but Recommended): * For detailed steps on setting budget notifications, please refer to the documentation on Budget Alerts.
Budget Details
After creation, you will be redirected to a view displaying the list of budgets created for this specific cost group.
- Draft Budgets: Users can save a budget as a draft if they are not yet ready to activate it. Drafts can be configured or deleted later.
- Active Budgets: Once a budget is created (not a draft), it becomes active.
- Expired Budgets: A checkbox allows users to view past budgets that have exceeded their end date.
- Reload Button: This fetches the most up-to-date budget data for the cost group.

Click the Budget Name to see an overview of the created budget.
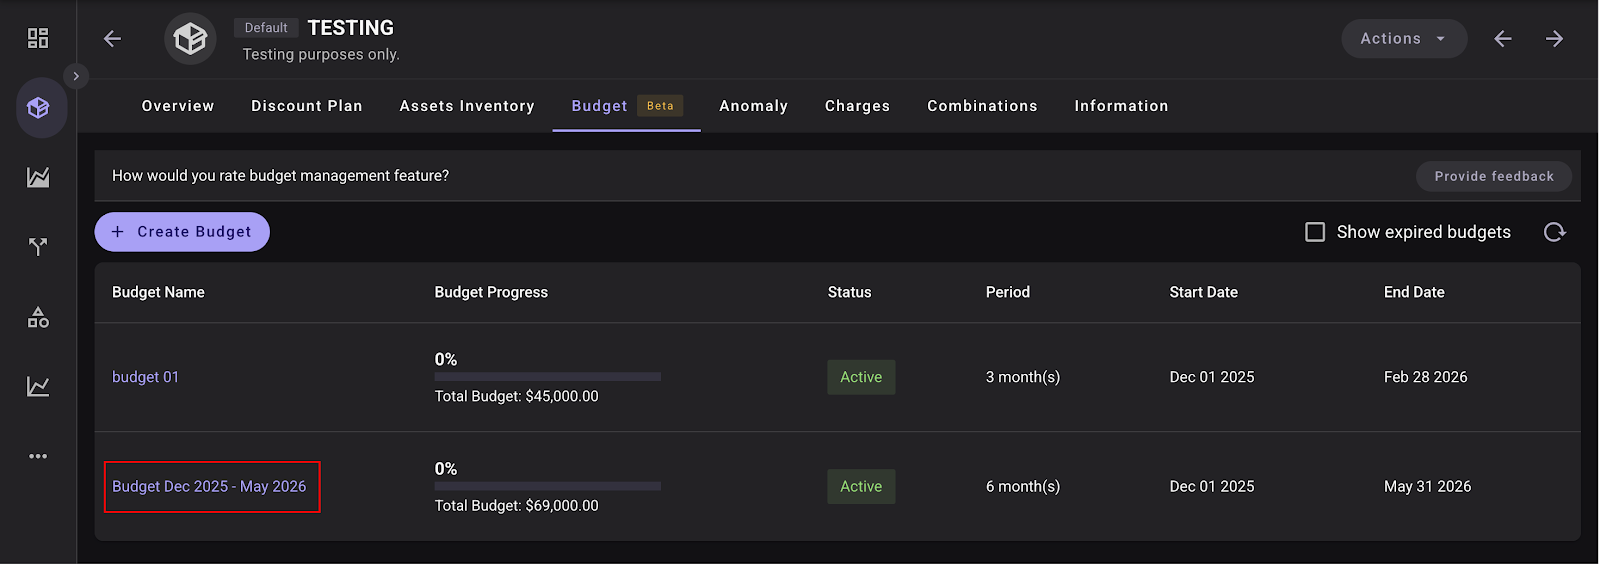

- Actual Cost: This row shows the current cost for each month, updating in real-time.
- Budget: This row shows the amount of budget you set during creation.
- Budget Progress: This indicates the percentage of the total budget that has been spent, offering a snapshot of spending patterns.
- Period: This shows the duration for which the budget is set.
Budget Settings
In the upper right corner, users can click the notification bell to create budget alerts. They can also edit, delete, or view budget details from this section.

Note: The "edit budget" and "delete budget" options are only visible to the budget creator or an admin. If a user is neither, these options are hidden.
Budget Widgets in Dashboard Reports
Octo allows you to visualize and monitor your budgets directly within dashboard reports. By adding budget widgets, you can track spending, compare multiple budgets, and gain insights into budget performance across different cost groups.
Types of Budget Widgets
-
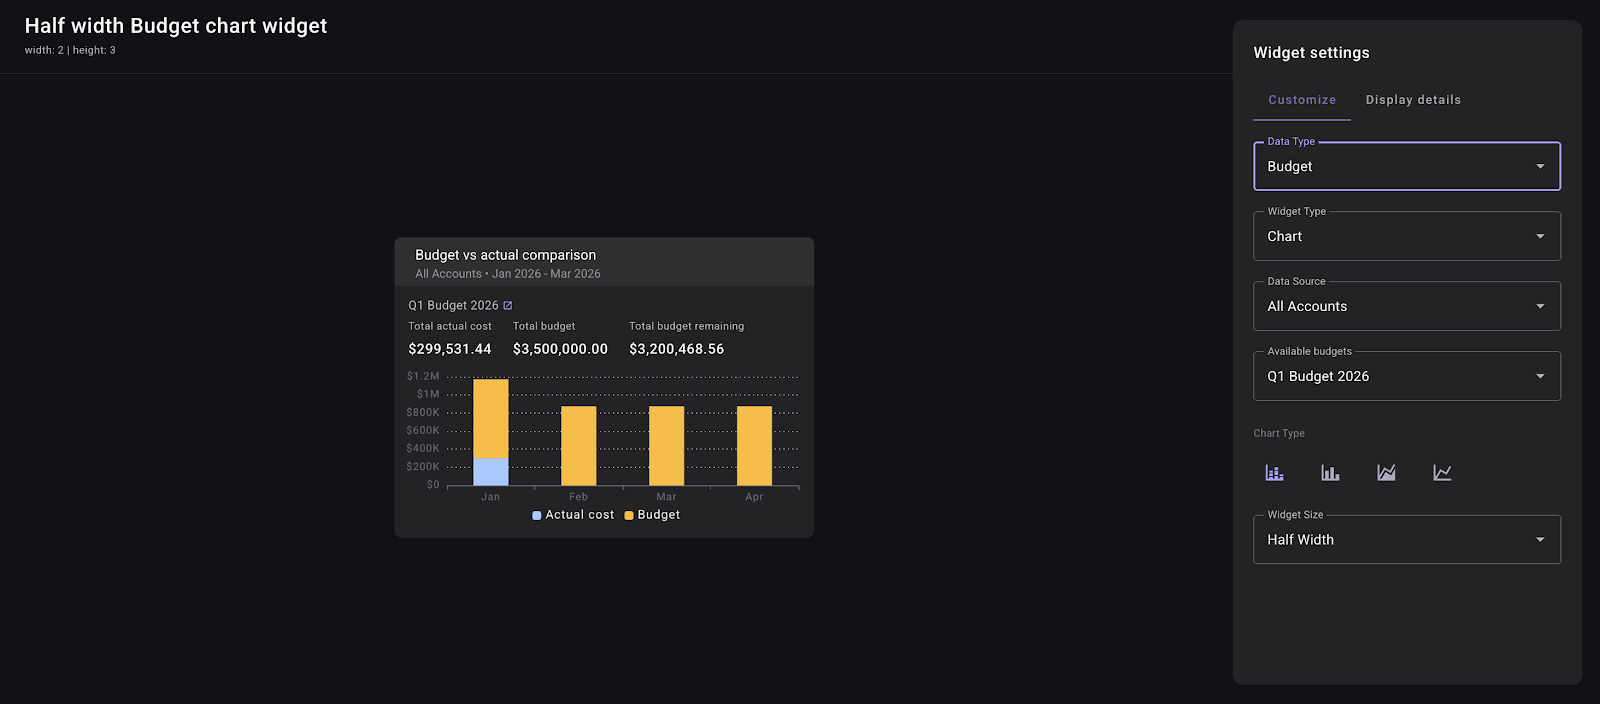
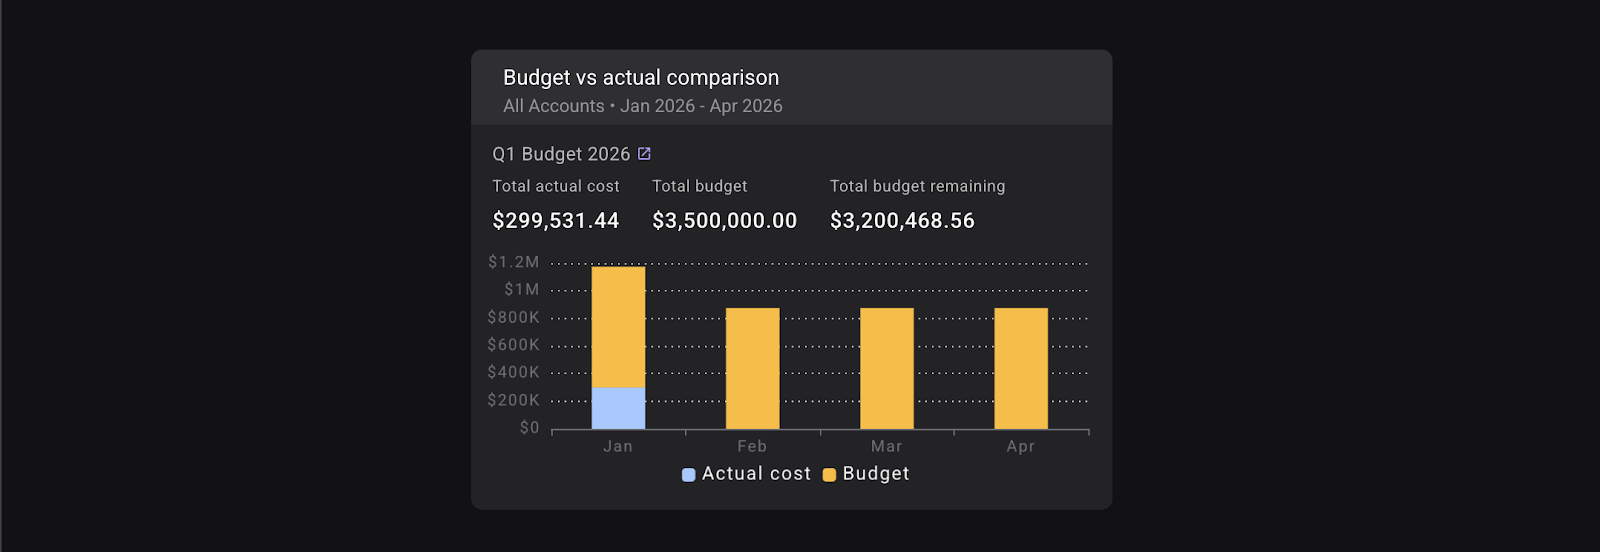
Chart Widget
- Provides a visual representation of budget versus actual spending over time. It displays the Total Actual Cost, Total Budget, and Total Budget Remaining for the selected budget within a specified cost group.
-
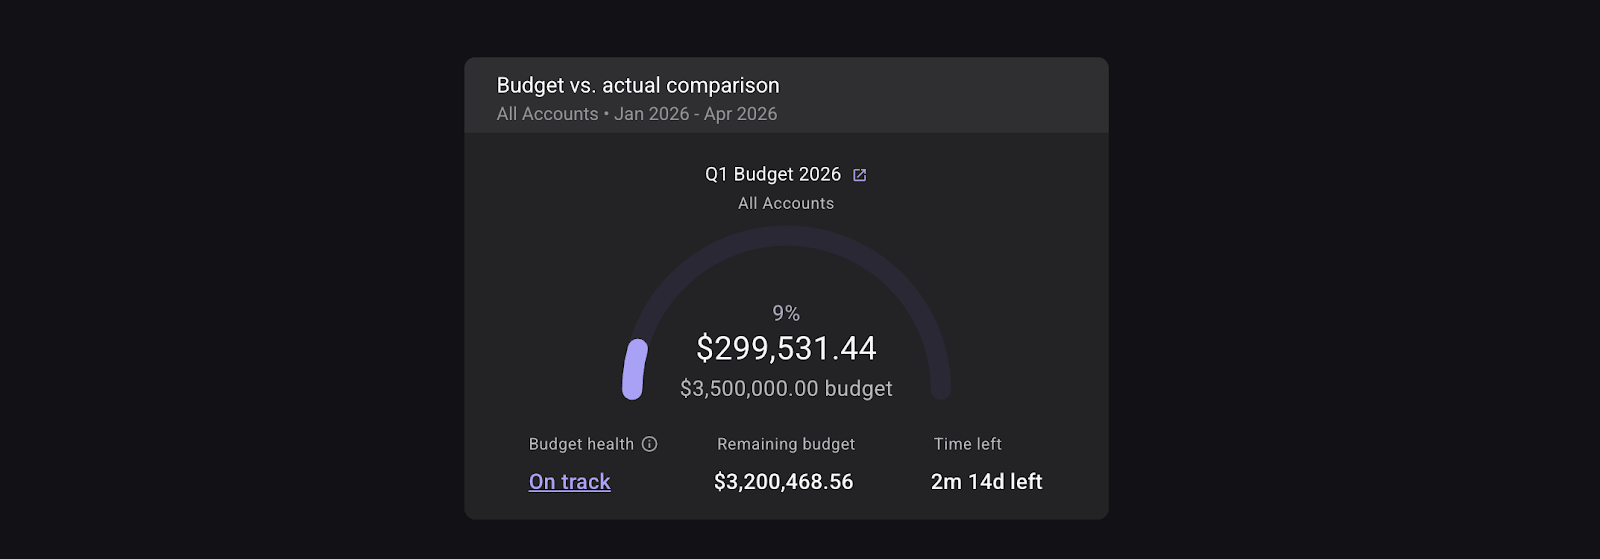
Single Metric Widget
- Summarizes budget performance using a budget health indicator.
- Shows Budget usage percentage, Remaining budget, Time left, and Overall budget health status
-
Allows users to quickly assess whether spending is aligned with the budget timeline.
Budget Health States:
- Under pace (Good): Spending is slower than expected.
- On track (Normal): Spending is aligned with the expected pace.
- Warning (Monitor): Spending is faster than expected and should be monitored.
- Critical (Action needed): Spending is significantly ahead of schedule and requires immediate attention.
How Budget Health Is Determined:
Budget health is calculated using variance, which compares the percentage of budget used against the percentage of time elapsed for the selected budget period.
Variance formula:
Example calculation:
Time elapsed: 32% (29 of 92 days)

Budget used: 10% ($10,000 of $82,000)

Variance: 10% − 32% = **-22%**
A negative variance indicates spending is slower than expected (good), while a positive variance indicates spending is faster than expected (warning or critical).
Variance Ranges:
Less than -10% → Under pace (Good)
-10% to +5% → On track (Normal)
+5% to +15% → Warning (Monitor)
Greater than +15% → Critical (Action needed)
-
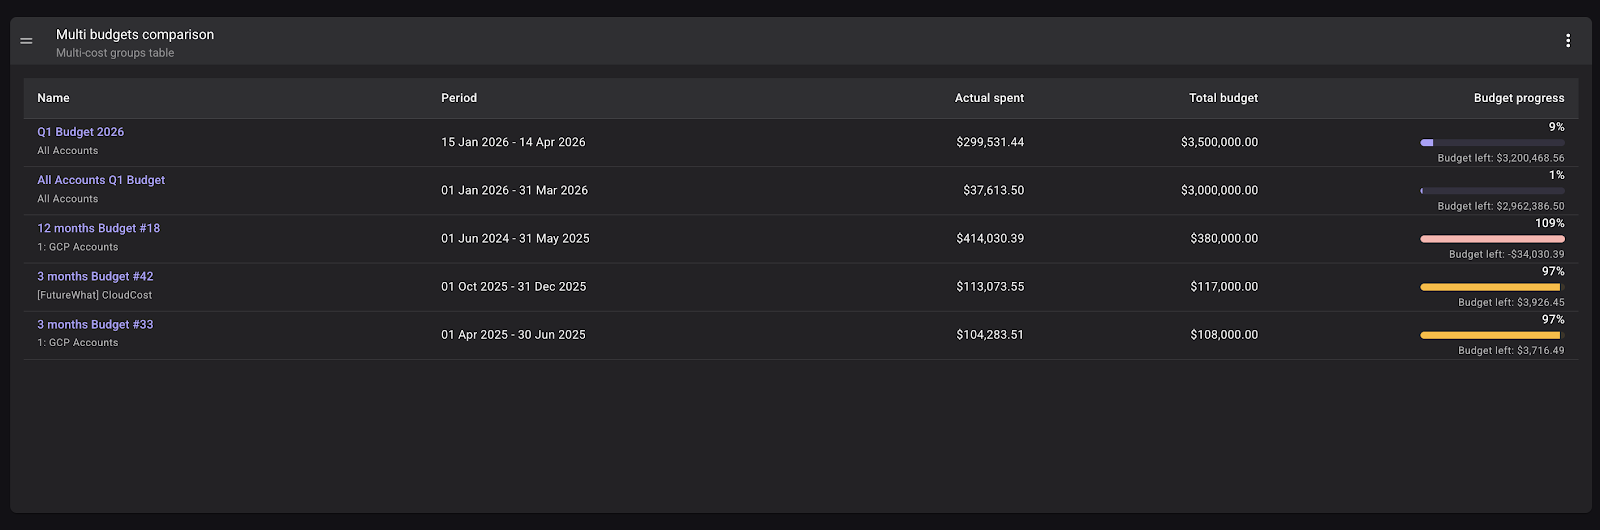
Table Widget
- Displays a detailed, multi-budget comparison across cost groups. Can be configured to show budgets within a specific cost group or across multiple cost groups.
Adding Budget Widgets to Reports
Follow these steps to add budget widgets to your dashboard reports:
-
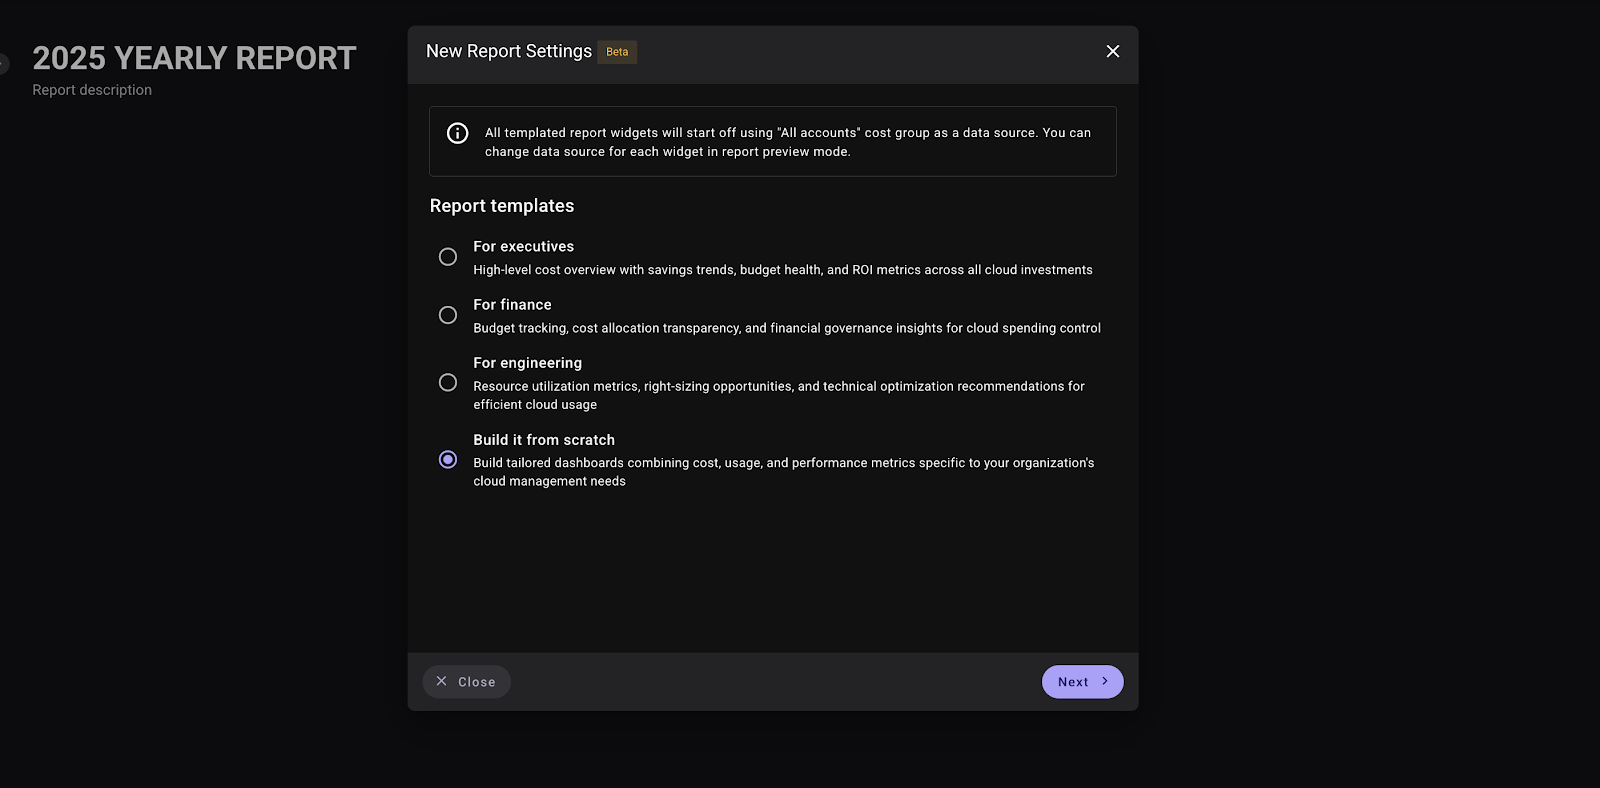
Create a New Report
- Click New Report from the dashboard.
- Select Build it from scratch to create a custom report.
-
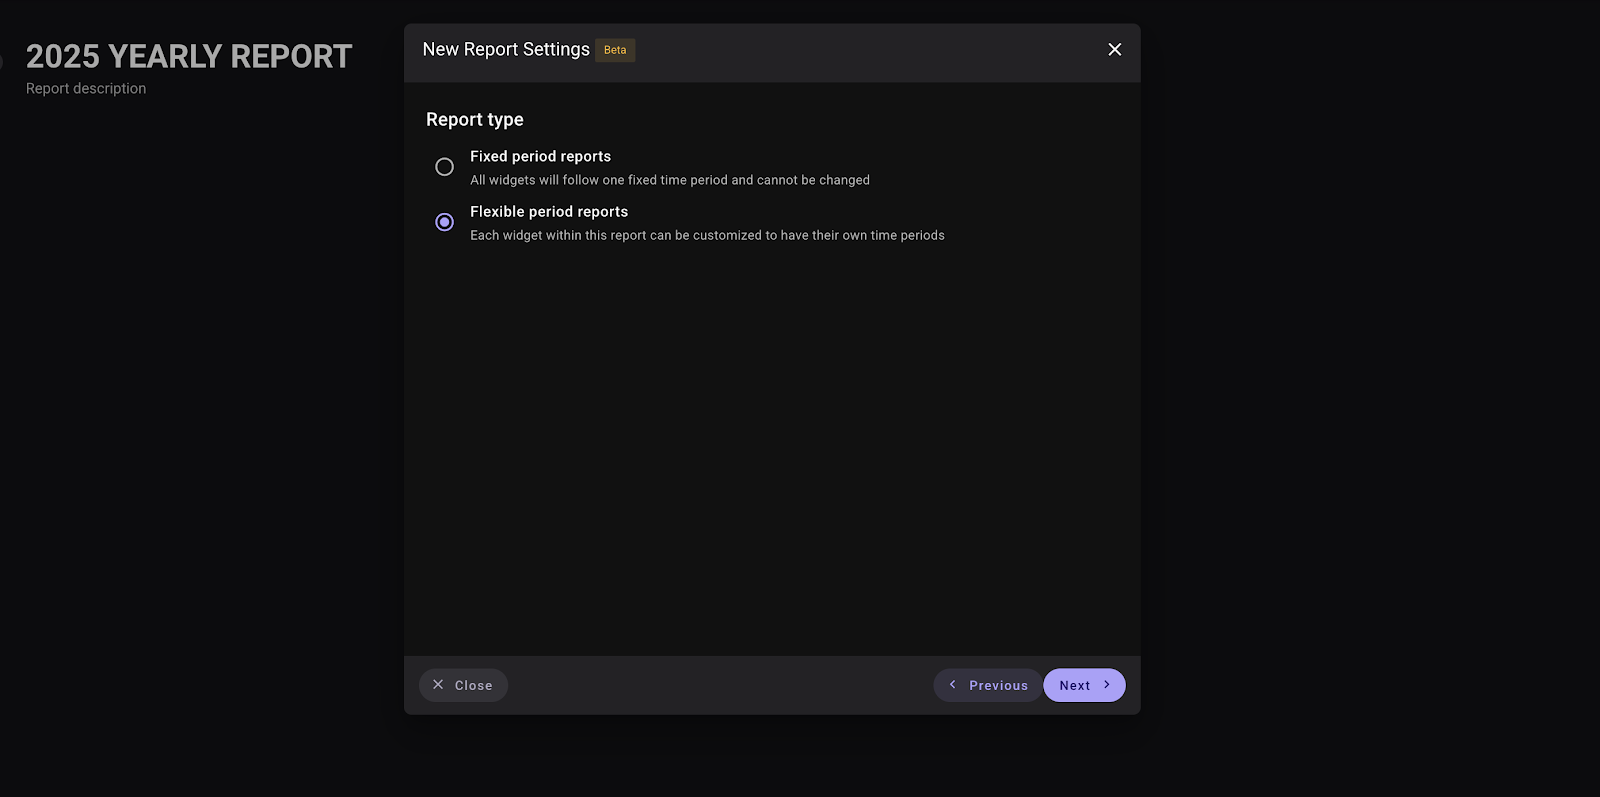
Choose Report Type
- Select one of the following report types:
- Fixed Period Reports: All widgets follow a single, fixed time period that cannot be changed individually. Budget widgets will display data based on each budget’s defined period.
- Flexible Period Reports: Each widget within the report can be customized with its own time period settings.
- Click Next to proceed.
- Select one of the following report types:
-
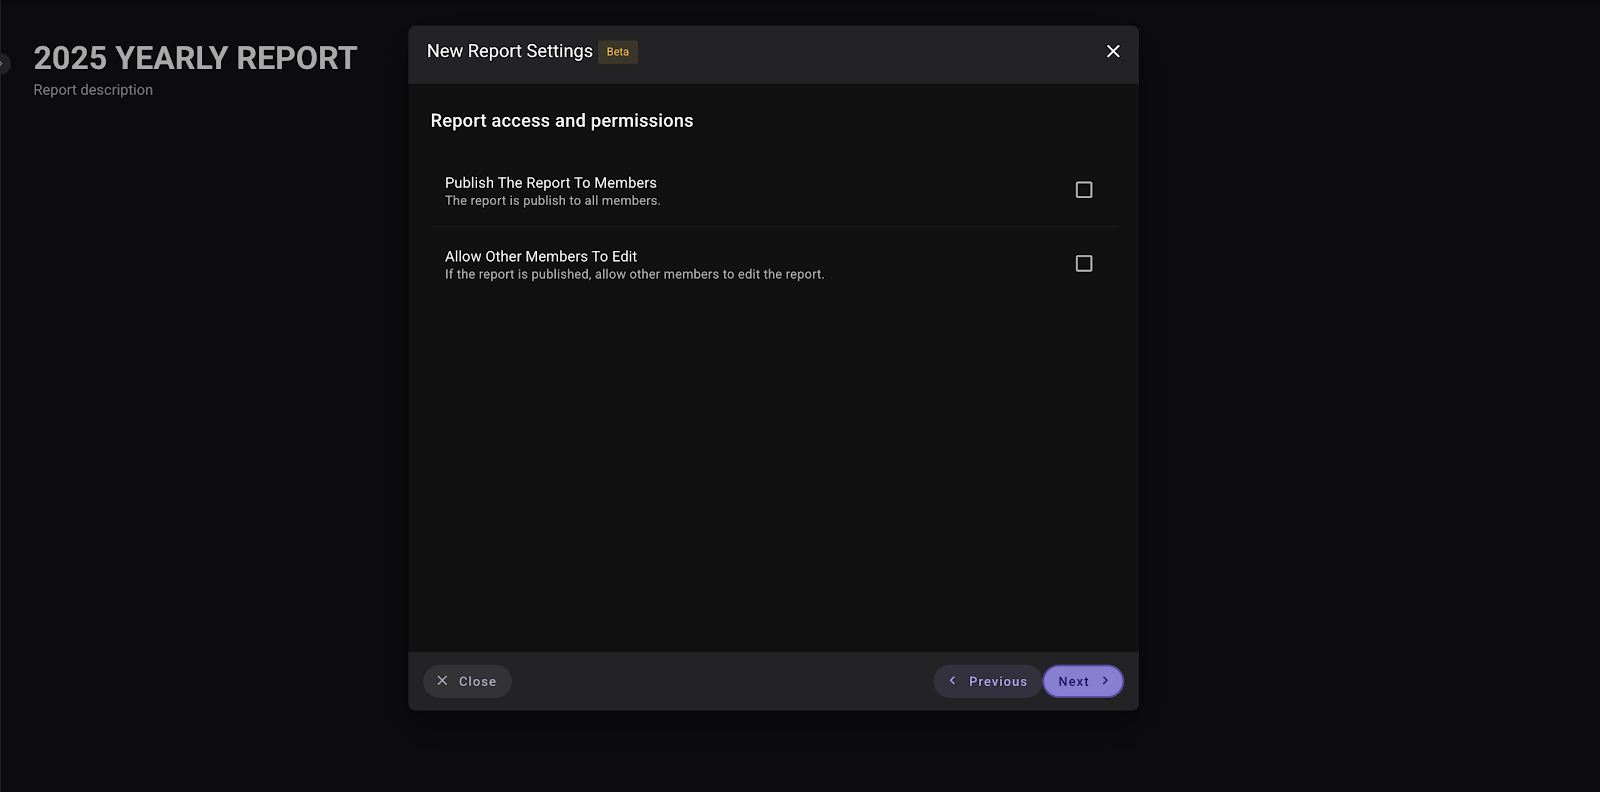
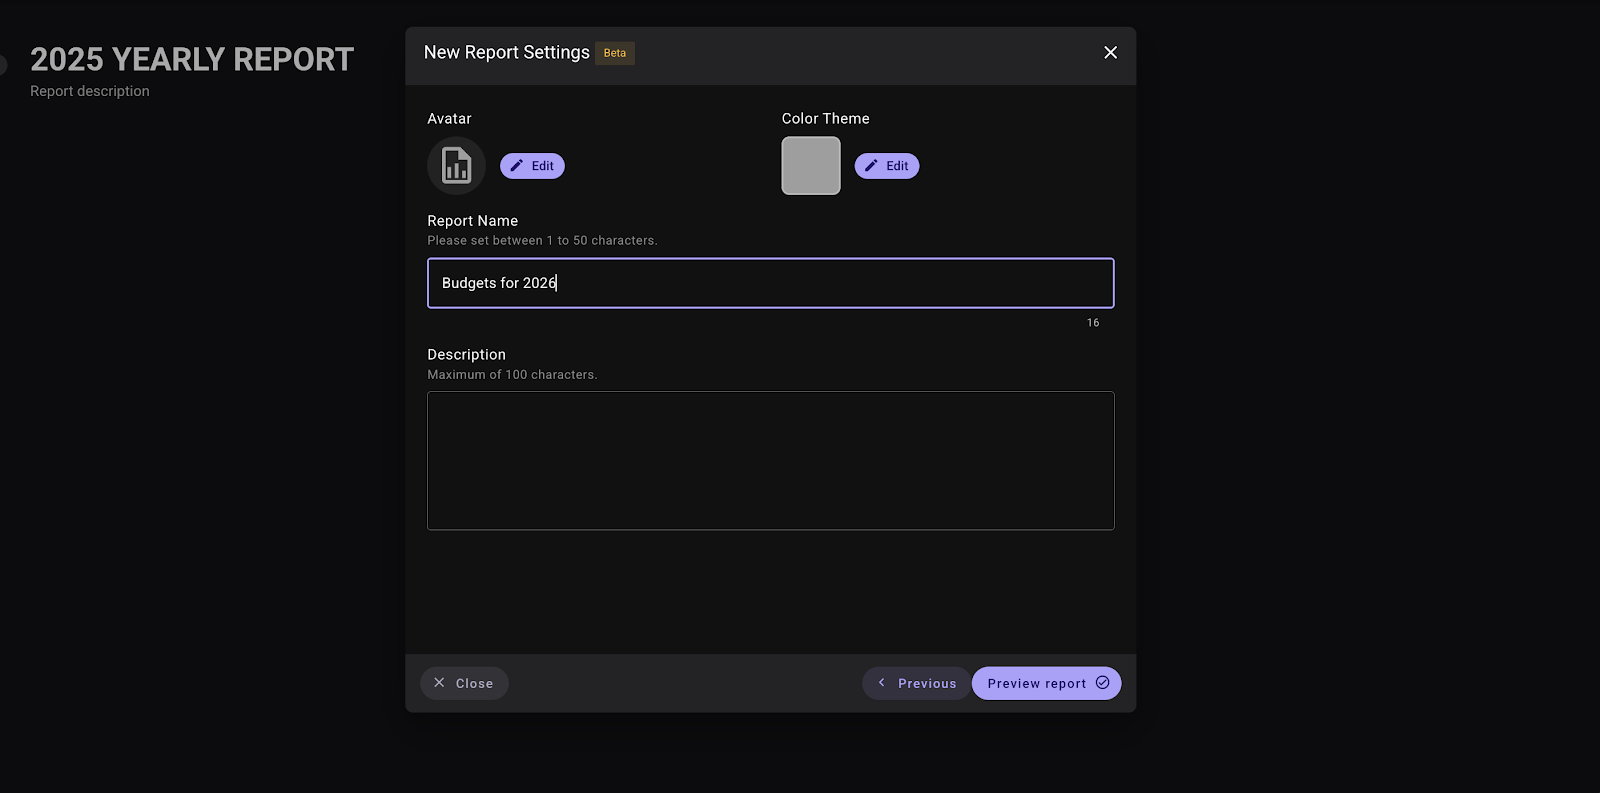
Configure Report Settings
- Review access and permissions (define who can view or edit the report).
- Set the report name and description.
- Click Preview Report to continue.
- Review access and permissions (define who can view or edit the report).
-
Add Budget Widgets
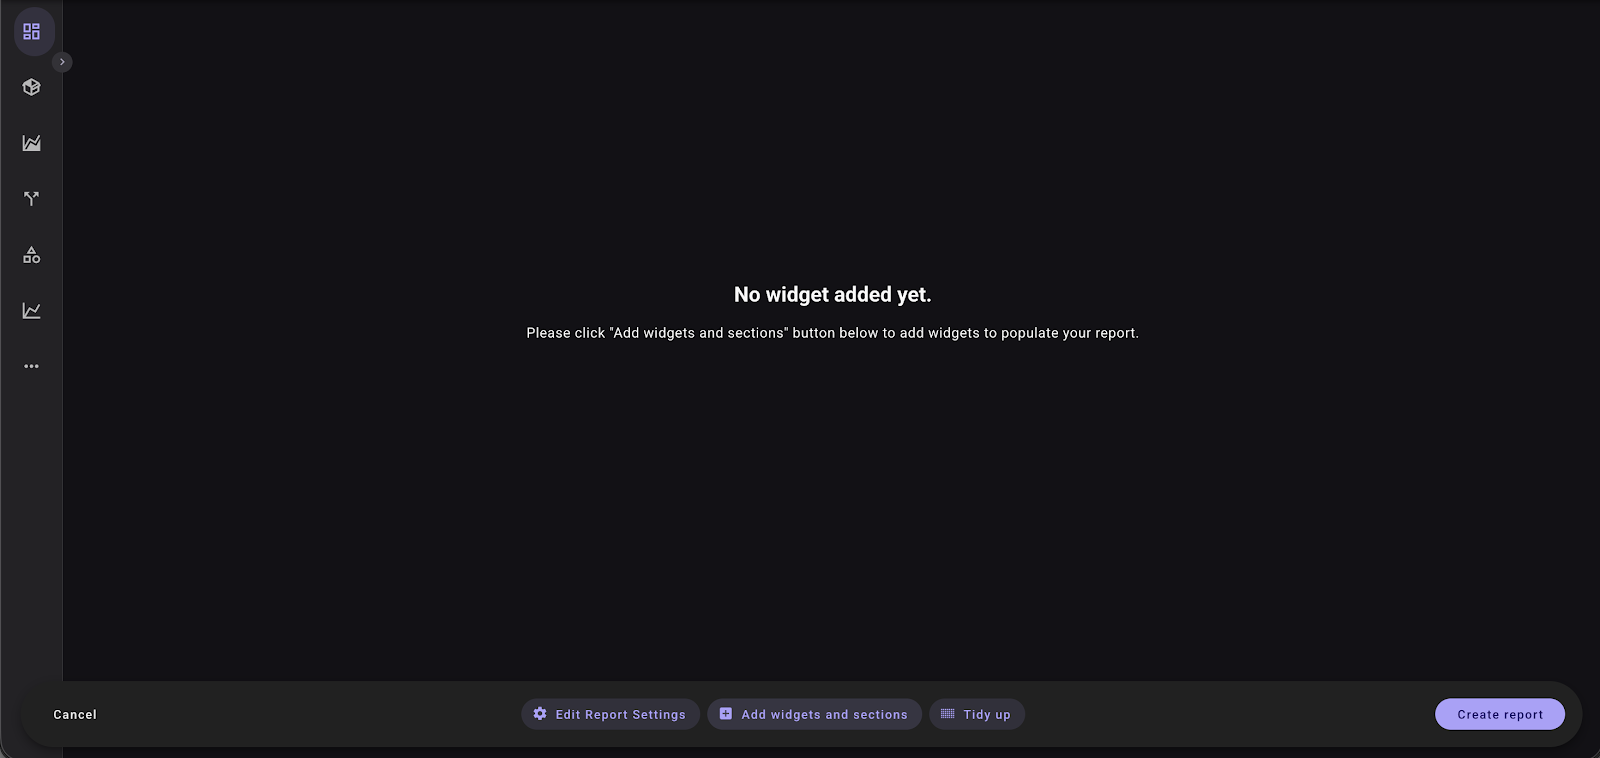
- Since a newly created report is empty, you will need to add widgets:
- Click Add Widget or the “+” button.
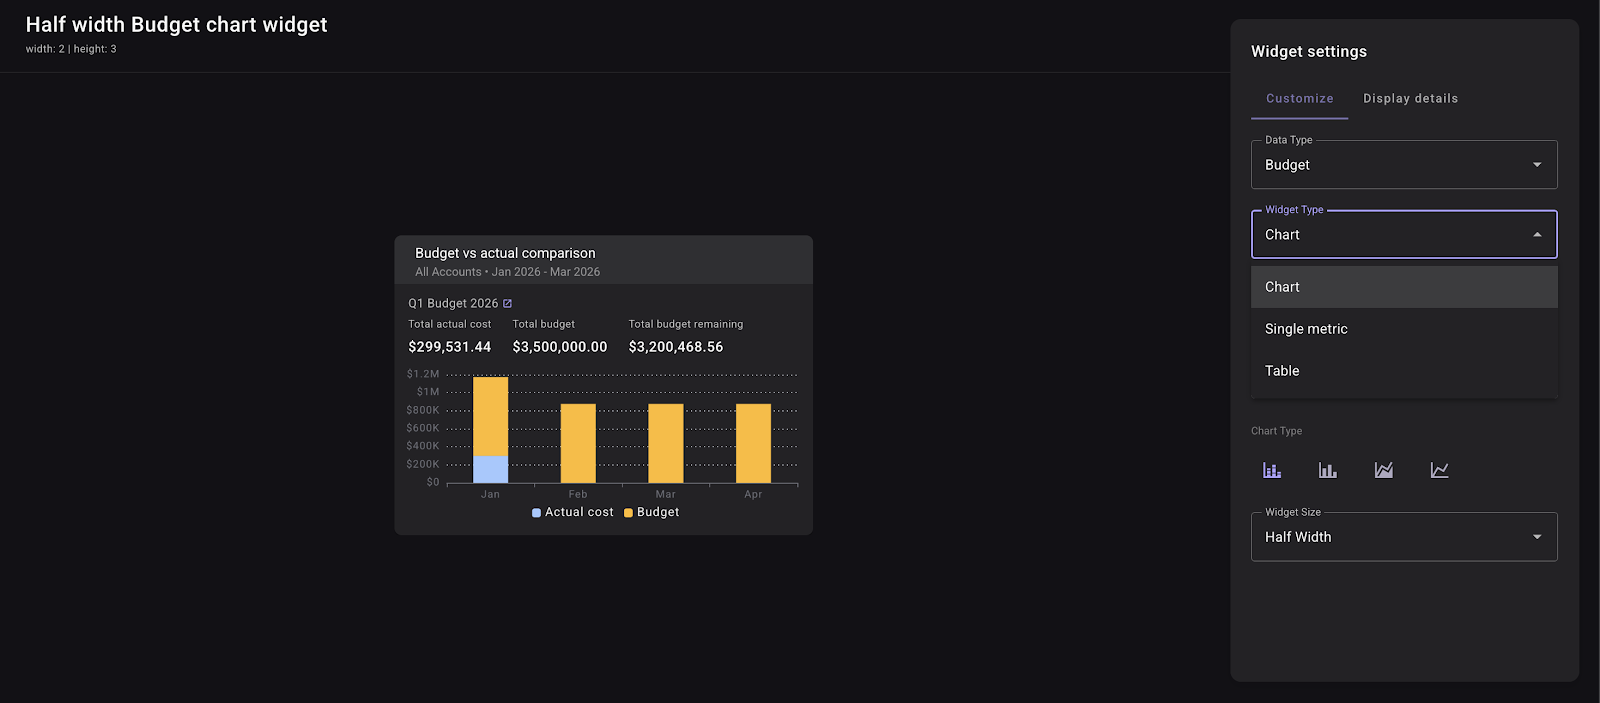
- Select Budget as the Data Type.
- Choose your preferred Widget Type (Chart, Single Metric, or Table).
- Click Add Widget or the “+” button.
- Configure the widget as needed, then click Add Report to add it to the dashboard.
- Since a newly created report is empty, you will need to add widgets: